

Real measures of intelligence
Rasch measures vs. IQ - How much smarter are you than a kid?

This post is important for anyone who was a smart kid or who has an interest in the education of smart kids.
IQ is not a measure of intelligence — older kids are smarter than younger ones with the same IQ score. There is another type of intelligence score that can be compared between people of different ages. This type of scale, called a “Rasch” measure, is used in the major IQ tests: Stanford-Binet and Woodcock-Johnson (WJ, WJ v.4 or WJIV).
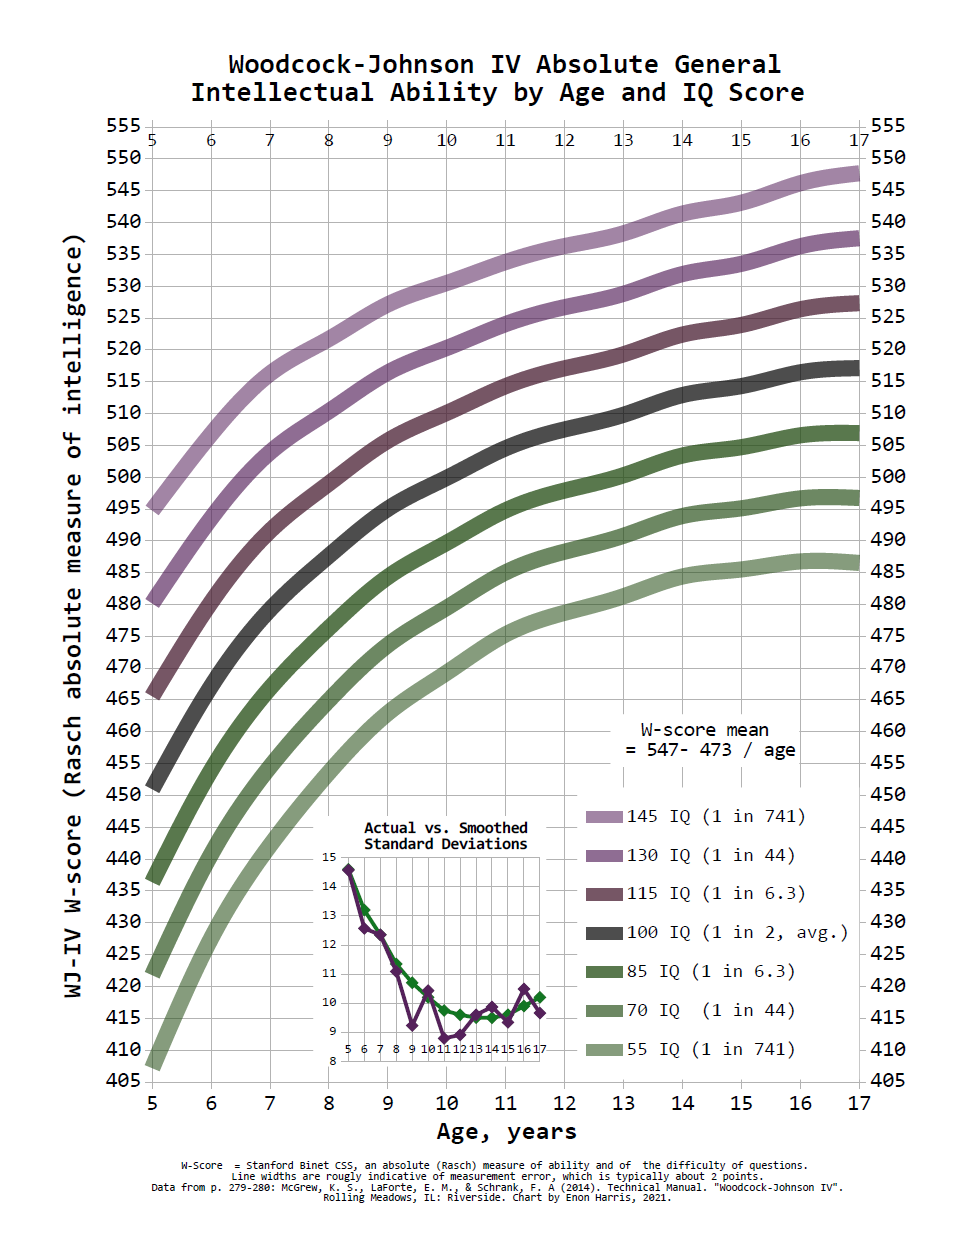
This graph comes from data from the Woodcock-Johnson IV Technical Manual, p. 279-280. (large pdf, link opens in new window.). Rasch measure Intelligence vs Age.pdf [Google Drive, single-page PDF (71kB)] It will help to have the PDF open alongside the discussion.
This is a chart made to play with. It helps to know the average, 100 IQ adult W-score is about 520 with a standard deviation (SD) of about 10, rather than the SD 15 of IQ scores.
The range of abilities in a kindergarten class can be bigger than the difference between the average kindergartner, age 5.5, and the teacher. The second green line gives the -2 SD development curve. It starts out at age 5 at about 422. Now look at the second purple line, the +2 SD line is at about 494 at age 6, which is 72 points higher. The average (grey line) 5.5 year old scores 460, 72 points above that is 532, which is well above the 510-530 range of most kindergarten teachers (bottom 10% to top 25%, average is about 523).
Look at the second purple line, that is: top 1 in 44, +2 SD (standard deviations), 130 IQ. It crosses the 520 horizontal line at age 10. Over 2% of students will be smarter, get higher raw scores, solve more difficult problems at age 10 than the average adult. Some are held back far more than that. Here’s a chart of a +3.5 SD score (152.5 IQ), about top 1 in 4300, with a bunch of adult comparisons which have a citation at IQcomparisonSite.com1, but should be taken with a grain of salt:
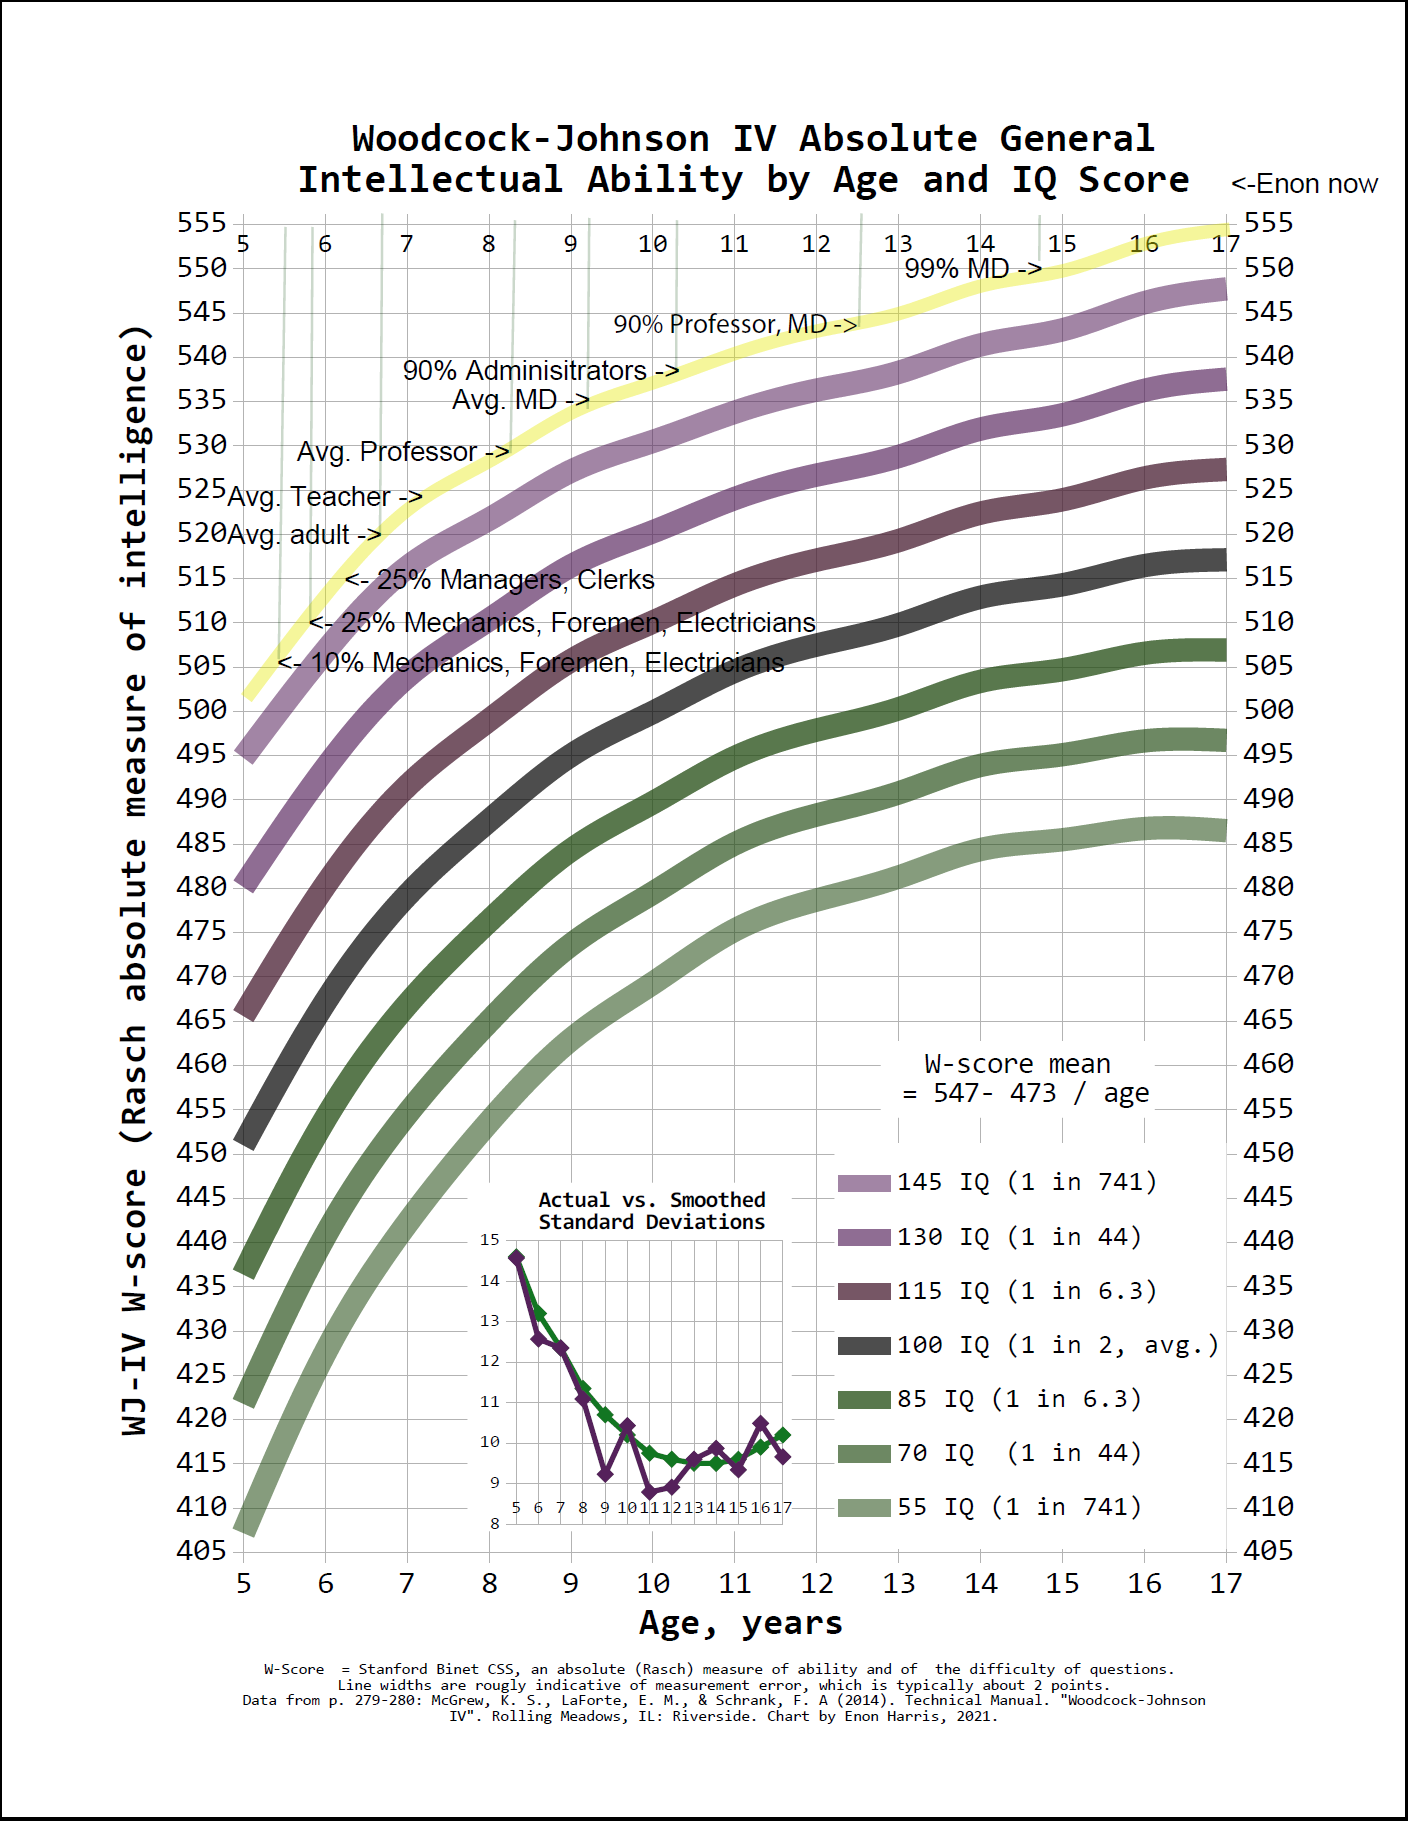
Examples from playing with the chart:
The +3.5 SD child is smarter in terms of difficulty and number of questions answered correctly than some adults in first and second grade, than most teachers by age 7, most professors by age 8, and 90% of professors and MDs by age 12.5. As an adult with a score of 560, the 45 point gap between him and someone with a W-score of 515, commonly seen in most occupations on the low end, is as big as the gap between an adult and a 6.5 year old child of the same IQ, or more than twice as big as the gap between an adult and a 10 year old of the same IQ, or three times the gap between the 515 adult and an average 10 year old. His 30 point gap with the average professor at 530 is as big as between the professor and the average 10 year old at 500.
Even for ordinary scores, +1 SD to -1 SD, the range found in a representative group of just 6 or 7 people, at age 9.5 the +1 SD beats the 16.5 year old at -1 SD, a 7 year gap.
A top 5% 9.5 year old (125 IQ) scores the same as a top 30% 13 year old (108 IQ), three-and-a-half years ahead, despite likely being in the same classes.
In many of today’s schools, students between the 5th and 25th percentiles (75 to 90 IQ, -1.67 SD to -0.67 SD) are usually tracked into the same classes as all the higher ability students, despite being 3 to 6.5 years behind the average student, or 4.5 to 8 years behind top 25% students.
One quarter of 12.0 year-old children are smarter than one-quarter of adults (W-score 515). Five percent of 9.0 year-olds are smarter than 5% of adults (W-score 502).
Kids smarter than most teachers (W-score 525): about 1 in 1000 at age 8; 1 in 100 at age 10; 1 in 30 at age 12; and 1 in 8 at age 14.
Kids smarter than 10% of teachers (W-score 510): about 1 in 1000 at age 6; 1 in 50 at age 8; 1 in 6 at age 10; half by age 13; 3 in 4 by age 16.
Kids smarter than 90% of teachers and most MDs (W-score 537): 1 in 1000 at age 11; 1 in 50 age 15.
The rest of the article may be less interesting to many people, it certainly isn’t polished. In the interest of getting this published, please forgive the mess.
On W-scores
These W scores are not fantasy equivalences, they are monotonic functions of raw scores on the same well-constructed tests. W-scores measure the difficulty of questions that one can answer correctly (with 50% probability). W-scores are a measure of units of g, general mental ability, at least in the case of the full-scale IQ (FSIQ) W-score (there are other W-scores for every test and ability cluster).

Except for Gc (comprehension-knowledge), scores age 70+ are lower than for ages between 12 and 16, depending on the type of ability. There is no rationale on the basis of mental ability to postponing the age of majority beyond age 16. Uniquely, Gc is at a peak age 50 - 70, but varies only from slightly from age 20-80.

The WJ's “W-scores” are “equal-interval scales”, rulers with evenly-spaced marks. This is not true when comparing IQ scales for different ages, which have different variances (standard deviations, SDs) of the raw test scores at different ages, which are all then scaled separately to give the same 15-point IQ SDs at all ages, making the size of the IQ points vary more than 60% across different ages. For example, the W SD at age 5 is 14.5, at age 13 it is at its minimum of 9.5, and in adulthood it increases from 10 in the 20s, to 12 in the 40s and 50s to 14 in the 60s.
The size of W-points is scaled so that a 10-point increase in W score increases a person’s probability of answering a question correctly from 25% to 50% (or from 50% to 75%). The W-scale measures both ability of test takers and the difficulty of questions. When a person with a certain ability W-score has a 50% chance of getting a question right, that question has the same difficulty score as the person's ability score.

As the ability score goes up, the probability of getting a question of a given difficulty correct rises gradually, it isn't a step function, but a soft logistic curve. To go from a 2% chance of getting a question right to a 2% chance of getting it wrong takes about a 70-point increase in W (about 7 SD, +/-3.5 SD, or top 1 in 4300 to bottom 1 in 4300). To go from 10% right to 10% wrong is still 40 points, top 1 in 44 to bottom 1 in 44, IQ 70 to IQ 130. If you want to keep the percentage of a class that gets any given question correct between 25% and 90%, then that is a range of -10 to +20 W-score points. If the questions were all of the same difficulty, or the students all the same ability, that would be +/-15 W. Generally, then the students should all be within about 15 W-points or 1.5 SD of each other, and the test questions should be within a similar range.
Because the logistic curve is approximately exponential on the left, inverse-exponential on the right, and linear in the middle, for difficult questions, questions where the difficulty score is much higher than ability scores, an increase in ability gives an exponentially higher likelihood of solving the problem (though still a low chance in absolute terms), while for very easy questions, increases in ability give exponentially lower chances of failing to correctly solve the problem; when the problem and ability are within 10 points of each other, the relationship is approximately linear, so each point of W-ability increases the odds of success by about 2.5%.
This means that for the hardest problems, ones that no one has ever solved, the ones that advance civilization, the highest-ability people, the top 1% of 1% are irreplaceable, no one else has a shot. It also means that populations with lower means, even if very numerous, will have super-exponentially less likelihood of solving such questions. E.g. a +1 SD average ability population will have 42 times as many 160 IQs (568 W score) per capita compared to the base case, and these will each have triple the chance (1.2%) of solving a problem with a difficulty of 608 W-score, compared to the 0.4% chance of the equally-numerous in the base case 145 IQs solving the problem.
Points to remember:
The adult average W-score in the 20s and 30s is about 520, SD 10.
(At age 17, W = 517; above age 50 or 55 it falls below 517 again: 514 in the 60s, 511 in the 70s.)
The score of an average 10.0 year-old is set by definition to 500.
(SDs for ages 8 – 40 are in the range 9-11)
Average scores for other ages between 5 and 17 can be computed quite accurately by:
W[age] = 547 - 473 / age (with age in years)
The round-number scores that it's easy to remember are:
SD 10,
Age 5: 450
Age 7: 480
Age 10: 500, increasing about 5 points per year.
Age 13: 510
Adult: 520
The increase in W-score per year depends almost only on age, not on IQ or W-score. At age 7, scores increase 10 points per year; at age 10, scores increase 5 points per year; at age 14, scores increase 2.5 points per year. (Ratio of developmental rates is exactly the ratio of the squares of ages.)
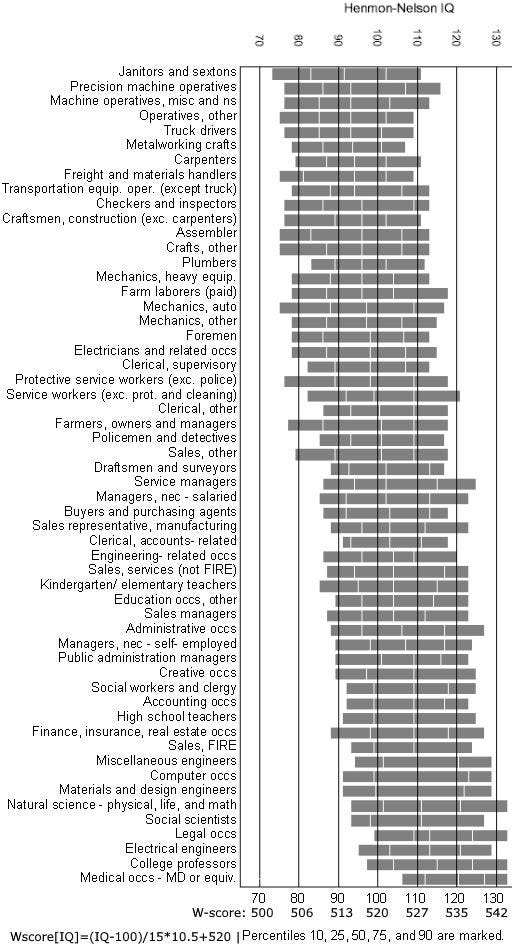
So this means that the difference in intelligence between and adult and a 10 year old is 20 points, which is 2 SD, which is about the difference between a top 1 in 6 (115 IQ) and a bottom 1 in 6 (85 IQ) person. That's similar to the gap between an average college professor and a bottom 25% janitor. The gap in intelligence between the top 10% and bottom 10% of high-status professions such as professors, lawyers and MDs is typically 20-25 points.
The intelligence distributions of jobs overlap substantially – the top 25% of janitors are as smart as the bottom 25 % of scientists or engineers, and not significantly below the average manager or schoolteacher. Nevertheless, below 505 one is too dumb to be a janitor; above 515 one has a shot at holding any but a handful of the most cognitively demanding jobs, above 525 one is capable of any occupation, and above 535 one can excel in any field.
Appendix A, spreadsheet functions
You can convert W-scores to adult IQ:
IQ_adult[W] = (W - 450)/0.7
Or convert adult IQ scores to W-scores:
W[IQ_adult] = 0.7 * IQ_adult + 450
(IQ mean 100, s.d. 15; IQ_adult preferably age [20, 40], but not too far off for ages [18, 70])
Or find the W-score or adult IQ equivalent of a child’s percentile for their age:
W[percentile, age] = ( NORMSINV(percentile) * (23/321 * age^2 - 167/87 * age + 89/4) + (547 - 473/age) )
IQ_adult[percentile, age] = ((NORMSINV(percentile) * (23/321 * age^2 - 167/87 * age + 89/4) + (547 - 473/age)) - 450)/0.7
(age from 5 to 17, percentile is between 0 and 1, with 0 being lowest, 0.5 being average, and age not being the child’s actual age but the average age for which the test was designed and relative to which the percentile standings are reckoned. NORMSINV( ) is a spreadsheet function.
Or find the W-score for an IQ and age:
W[IQ, age] = ((IQ - 100)/15) * (23/321 * age^2 - 167/87 * age + 89/4) + (547 - 473 / age)
(age from 5 to 17, use child’s current age for current W-score; if you use some other age, you get the W-score at that age)
Or find the W-score one will have in the future or used to have in the past:
predicted_W[W_age_1, age_1, age_2] = ((W - (547 - 473 / age_1))/(23/321 * age_1^2 - 167/87 * age_1 + 89/4))*(23/321 * age_2^2 - 167/87 * age_2 + 89/4) + (547 - 473 / age_2)
Or even find how a child will rank in a class of a different age, e.g. after a grade skip:
percentile_in_placement_class[child_percentile, child_age, class_age] = NORMDIST((( ( NORMSINV(child_percentile) * (23/321 * child_age^2 - 167/87 * child_age + 89/4) + (547 -473/child_age) ) - (547 - 473 / class_age))/(23/321 * class_age^2 - 167/87 * class_age + 89/4)),0,1)
percentile_adult[child_percentile, child_age] = NORMDIST(((( NORMSINV(child_percentile) * (23/321 * child_age^2 - 167/87 * child_age + 89/4) + (547 - 473/child_age) ) - 520)/10.5),0,1)
(for both child_age, class_age in ages [5,17] — use percentile_adult for class age over 17; child_age not being the child’s actual age but the average age for which the test was designed and relative to which the percentile standings are reckoned.)
Due to the faster rate of increase of ability at younger ages than older ages, when using percentile_in_placement_class function the calculation should be done at least twice: for the ages at the start and end of the school year or term. Note that the percentiles in percentile_in_placement_class are relative to the whole population of that age, not that specific class. If the class is selective, e.g. has members in the 90% - 98% range on tests for their age, then you want similar numbers for percentile_in_placement_class of incoming students of other ages. )
Here is a spreadsheet file with derivations, notes, and more functions useful for radical acceleration and other placement of gifted children.
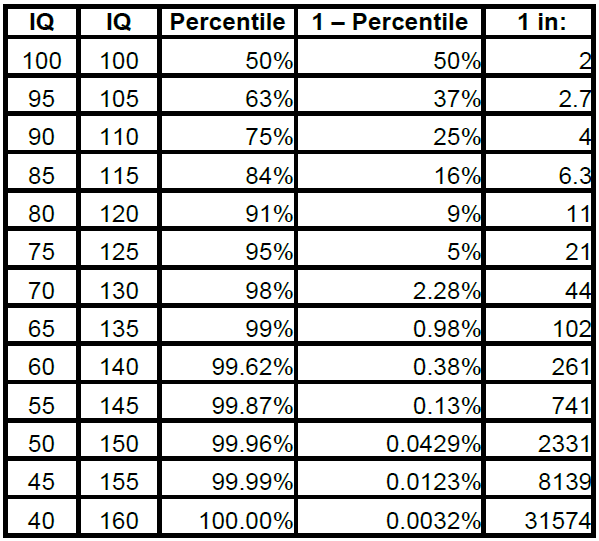
Appendix B, IQ
A little review: IQ is sometimes referred to as “Deviation” IQ, since it based on the number of standard deviations a test-taker’s raw score away from the mean raw score for that age. The mean raw score for that age is converted to scaled score of 100 IQ, and the number of standard deviations the test-taker’s raw score is from the average is multiplied by 15 (usually). So an 85 IQ is 1 s.d. below average for that age and a 115 IQ is 1 s.d. above average. About 1 in 6 people score more than l standard deviation above average, another 1/6th score 1 s.d. below average. The distribution of intelligence closely follows the normal distribution, which falls off super-exponentially the farther you get from the mean. IQ assumes that intelligence is distributed normally1, but the tails of the actual distribution seem to be slightly fatter than the normal curve predicts, making high deviation-IQ scores lower than the true intelligence.

Appendix C, misc. notes on Rasch measures
Rasch measures, named after Georg Rasch, form the basis for item response theory (IRT) in general. Rasch measures have the interesting property of putting item difficulties and test-taker abilities on the same scale, so that a if a person with a certain ability score tries an item with the same difficulty score, then he has a 50% chance of success. Using a table with each row being a different test-taker and each column being a different question, with each entry indicating whether that person got that question right or wrong, re-sorting the table so the “correct” or “1” entries are clustered as much as possible in one corner of the table, it is possible to measure both the difficulties of all the questions and the abilities of all the test-takers, even if some of the questions are “bad” (and to find which ones they are), and even if most of the entries are blank (nobody tried to answer all the questions, and no question was tried by everybody). This allows test construction and validation to be an ongoing process, and is also the basis for computerized adaptive testing, which allows getting accurate scores without test-takers having to waste time on questions that are too easy or too hard.
Rasch measures are equal-interval scales, 1 point is the same size wherever it is on the scale, that is, it is a ruler with marks that are evenly spaced. This is only approximately true for IQ at a given age and not true when comparing IQ scales for different ages. For these reasons, among others, for many years the major individually-administered IQ tests, the Stanford-Binet (SB) and the Woodcock-Johnson (WJ) (both published by Riverside) have used Rasch measures. In the SB test this is called a “Change-Sensitive Score” or “CSS”, and in the WJ it is called a “W-score”. These are about the same, with the average 10-year old’s score set to be equal to 500 in both. Both also make the size of the points so that a 10-point increase in score increases a person’s probability of answering a question correctly from 25% to 50% (or from 50% to 75%). There are actually different W-scores for each of the 47 subtests and 11 ability cluster scales WJ-IV Tecnical manual p.122-128.
The Woodcock-Johnson is one of the top IQ tests, which uses a Rasch measure of intelligence, called a W-score. (The Stanford-Binet uses a similar scale, but calls it “change-sensitive scale”, CSS). Rasch measures are absolute measures of ability, in the same way that lengths are absolute measures of distance – they have a true zero, so one can say this question is 10% harder than that, or equivalently, that one person is 10% more intelligent. The difficulties of questions and the abilities of test-takers are computed all together in a matrix with rows being test-takers and columns being questions, with each matrix entry being 1 if that person got that question right, and 0 if they got it wrong. Using matrix math, difficulties and abilities are computed simultaneously. A bootstrapping procedure can update the matrix with additional questions and test results, giving an ongoing update to test norming. After validating questions (a complex but not arbitrary process), the only free choice in making a Rasch measure is choosing a reference score that sets the scale, which for the W-score and CSS was chosen to make the average, 100 IQ 10.0 year-old’s score 500.

The ability of the examinee is B_n, the difficulty of the item is D_i, the probability of examinee n correctly responding to item i is P_ni. The scale for both B and D is called a logit scale.
If the examinee’s ability is higher than the difficulty of the item, P is above 0.5 (50%); if ability is lower than difficulty, the P is less than 50%; and if the ability and difficulty are the same, then the probability is 50%.
The W score for a given logit value is obtained by:
W = 9.1024 logits + 500,
or alternatively, one can find the original logit value from a W-score by
logits = (W - 500) / 9.1024
This eliminates
if W_(A-D) is the difference between examinee ability and question difficulty on the W scale, then:

Which is a logistic curve, a much softened version of a step function. For a 0-point difference, the probability of getting the answer right is 50%. If the ability is 10 W-score points higher than difficulty, the probability is 75%, if 10 points lower, it is 25%. For a 20 point difference, the probabilities are 90% and 10%.
This graph was adapted from Figure 12 of Hauser, Robert M. 2002. "Meritocracy, cognitive ability, and the sources of occupational success." CDE Working Paper 98-07 (rev). Center for Demography and Ecology, The University of Wisconsin-Madison, Madison, Wisconsin. The figure is labelled "Wisconsin Men's Henmon-Nelson IQ Distributions for 1992-94 Occupation Groups with 30 Cases or More" and is found at http://www.ssc.wisc.edu/cde/cdewp/98-07.pdf.